The Dynamic Duo: Google Analytics and Optimizely

You’re probably going to hear this from me a million times, but web metrics should be a critical component of every business. To recap, web analytics is defined as “the measurement and analysis of data to inform an understanding of user behavior across web pages” (Optimizely, n.d.). The data can help drive strategies to help businesses reach their objectives (Reed College of Media, 2021).
There are so many tools to help with collecting and analyzing data that it can be very overwhelming to choose one. Since these tools often involve a substantial investment, there are a lot of different things to consider. Different tools will be right for different businesses depending on their goals and the volume of data they’ll be collecting (Keating, 2020).
Choosing a tool is a pretty serious process because it can determine whether a business will gain valuable insights to help improve or if they’ll miss out on critical data (Keating, 2020). Kaushik (2010) wrote, “We tend to pick tools like we are picking a marriage partner. When we choose wrong, we don’t want to accept it. They reality is that few things will impact your chances at success more than picking the right set of tools for the unique needs of your company—small or medium or large.”
We’re going to talk about two powerful tools that complement each other: Google Analytics and Optimizely. When used together, these tools can amplify the insights that businesses gain about their website and customers.
Google Analytics is a free product and one of the of the most popular tools for gathering website analytics. The tool tracks a businesses’ website and provides detailed information about its customers and their behavior on the site (Reed College of Media, 2021).
Google Analytics provides features analytics intelligence; reporting; data analysis and visualization; data collection and management; and data activation. It is also meant to work seamlessly with integrations like Google Ads, Google AdSense, Google Search Console (Google Marketing Platform, 2021).
Google Analytics tracks metrics and dimensions in four main categories (Stitch, n.d.):
• Audience: This category helps businesses to learn more about their customers like who they are and where they’re located
• Acquisition: This section shows how a customer landed on your website. Did they find you through social media, an email, an advertisement, or through search?
• Behavior: This helps to understand what customers are doing on your website, like the duration of their visit and what content they’re looking at.
• Conversions: This category helps businesses to understand if customers are taking the desired action once they reach the website. This could be a purchase or a newsletter sign up (Reed College of Media, 2021-a).
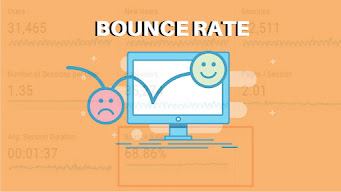
Some specific metrics within these categories that are useful for businesses are the number of users and sessions, average pages per session, the ratio of new to returning visitors, bounce rate, and the average time they are spending on different pages (Stitch, n.d.).

There are so many features with the free version that are suitable for small and medium businesses (HubSpot, 2021). For enterprise businesses, there is a paid version called of product called Google Analytics 360 the includes some extra features like access to raw data, unsampled reporting, unlimited data, up to 200 customer dimensions and metrics (compared to 20 in the free version), up to 400 views per property (versus 200), cross-property roll-up reporting, advanced attribution modeling, advanced, customizable funnel reporting, advanced analysis, audience sharing to Salesforce marketing cloud, integration with Google BigQuery, Google Video 360 integration, and Search Ads 360. Businesses that opt for this package will also receive an account manager (Frost, 2021).
One of the main reasons to collect data is to figure out what’s working and well and what’s not working well on a website (Reed College of Media, 2021-a). After businesses analyze the data, they can optimize their website to create more conversions based on their objectives. This includes creating a strong user experience and eliminating any issues on the site that arise (Reed College of Media, 20201-a).
Optimizely is a tool that can be super effective and helpful for optimizing websites, apps, TV apps, and IoT/conversational apps. The platform allows for the ability to run A/B tests and experiments to see what’s working best on a website and what is resulting in the most conversions. The website states that Optimizely will help to “accelerate release cycles and confidently drive conversion, adoption, engagement, and retention with the world’s leading progressive delivery and experimentation platform. Test and learn your way to winning results from UI/UX to features and application performance” (Optimizely, 2021-d).
This tool can help in other areas such as performance, program management, personalization, open platform, data and analytics, and statistics (Optimizely, 2021-d).

There are two main products: Full Stack and Web. Within each product are three different levels depending on the businesses’ needs. The levels are grow, accelerate, and scale. The price for these products is not available on the website. Anyone who is interested in learning more about the price is required to fill out a form.

Optimizely integrates with Google Analytics so businesses can get a side-by-side view of their traffic reports and the results of Optimizely experiments (Optimizely, 2021-b).
There are some key benefits to integrating the products (Optimizely, 2021-c):
- Businesses can connect the results of their experiments with key business metrics that they were tracking in Google Analytics
- Businesses can view experiment results in the Google Analytics dashboard, which can increase productivity and create a simplified workflow
- Businesses can use Google Analytics to gain new insights about the experiments run through Optimizely
Some companies and brands that have used Optimizely include HP, Microsoft, IBM, Visa, KIA, OpenTable, H&R Block, eBay, American Express, and GAP (Optimizely, 2021-d).
Blue Apron also uses Optimizely. The company reported that there was an increase in experiments after adopting the Full Stack product, which led to a 37% decrease in customer issues due to unexpected orders (Optimizely, 2021-a). By learning about the mistakes that customers were making on the website, the company was able to create a better customer experience and a smoother experience behind the scenes. Coupled with Google Analytics, learning about customers and gaining valuable insights could be the key to success.
Although this might not be the perfect combination of tools for every business, this dynamic duo could be very helpful for others. Google Analytics helps businesses learn about their customers and their behavior, while Optimizely helps to create a wonderful user experience for customers using those insights.
References:
Backhouse Media. (n.d.). Backhouse-media-google-analytics-logo-png. Retrieved from https://www.backhousemedia.com/digital-marketing-services/google-analytics-logo-1-2/.
Canva. (n.d.). Retrieved from https://www.canva.com/templates/.
Frost, A. (2021, January 8). The ultimate guide to Google analytics in 2021. HubSpot. Retrieved from https://blog.hubspot.com/marketing/google-analytics#:~:text=Analytics%20360%20begins%20at%20%24150%2C000,than%20one%20billion%20monthly%20hits.
Google Marketing Platform. (2021). Analytics. Retrieved from https://marketingplatform.google.com/about/analytics/.
Kaushik, A. (2010). Web analytics 2.0: The art of online accountability & science of customer centricity. Wiley Publishing, Inc.
Keating, G. (2020, December 10). How to choose the best analytics tools in 2021. Twilio Segment. Retrieved from https://segment.com/blog/data-analytics-tools/.
Optimizely. (2021-a). Customer Story: Blue Apron. Retrieved from https://www.optimizely.com/customers/blue-apron/.
Optimizely. (2021-b). Google Analytics. Retrieved from https://www.optimizely.com/partners/technology-partners/google-analytics/.
Optimizely. (2021-c). Optimization glossary: Web analytics. Retrieved from https://www.optimizely.com/optimization-glossary/web-analytics/.
Optimizely. (2021-d). Retrieved from https://www.optimizely.com/.
Reed College of Media. (2021-a). Week 1 lesson: Intro to web analytics and the basics of web analytics. Retrieved from https://ecampus.wvu.edu/webapps/blackboard/execute/displayLearningUnit?course_id=_155927_1&content_id=_7582539_1&framesetWrapped=true.
Reed College of Media. (2021-b). Week 2 lesson: Google Analytics. Retrieved from https://ecampus.wvu.edu/webapps/blackboard/execute/displayLearningUnit?course_id=_155927_1&content_id=_7582541_1&framesetWrapped=true.
Stitch (n.d.). 14 key metrics in Google Analytics for digital marketing. Retrieved from https://www.stitchdata.com/resources/google-analytics-metrics-for-marketers/.
World Vector Logo. (n.d.). Download Optimizely vector (SVG). Retrieved from https://worldvectorlogo.com/logo/optimizely-1

Comments
Post a Comment